Reinvent 2020 3 Container Insights
Re:Invent 2020 3 – Container Insights

Re:Invent is AWS’s annual learning conference, and this is the first one I’ve been able to attend (virtually of course!). I’m going to write up my thoughts on some of the talks that I enjoyed and got value out of, though there has been a lot of other great stuff at the conference.
“Getting an insight into your Kubernetes applications”
This talk was given by Sudeeptha Jothiprakash, explaining the support for Prometheus metrics on CloudWatch Container Insights.
Microservice diagnostic needs
Jothiprakash started with an overview of the needs expressed by AWS customers for monitoring of microservice-based environments, identifying three main needs:
- Getting a birds eye view of the application to understand its components and locate the source of problems
- Drilling down into specific components and workloads to investigate issues
- Derive insights from metrics and logs collected across the environment
Cloudwatch Container Insights
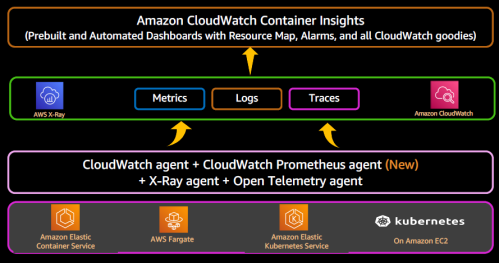
What Container Insights provides is prebuilt and automated dashboards with CloudWatch features. The information in Container Insights is provided by Cloudwatch agents, X-ray agents, Open Telemetry agents and the new Cloudwatch Prometheus agent.

Container Insights and Prometheus
Container Insights is now supporting the use of data from Prometheus, the popular open source monitoring tool. A CloudWatch agent on your Kubernetes cluster will gather metrics from Prometheus endpoints on your Kubernetes cluster and publish them as CloudWatch metrics which are then flushed through to Container Insights.
The new version of Container Insights allows, for example, monitoring of pod performance by namespace. Also new is a Resource view that shows a list view of clusters, tasks and namespaces in your environment so you can easily look at a particular component. This can be ordered by CPU or memory usage to quickly identify issues.
To better understand the dependencies between the components, there is a Map view (dependency tree) showing these dependencies between clusters, namespaces, pods, workloads and so on. You can also view basic metrics on a component from this view.
Takeaway
To conclude, Jothiprakash summarised how the new features meet the customer needs from the introduction.
- Getting a birds eye view of the application to understand its components and locate the source of problems
- Container Insights Resource view with Map & list views
- Drilling down into specific components and workloads to investigate issues
- From the Resource map view you can narrow down to a specific namespace, service or pod for deeper details
- Derive insights from metrics and logs collected across the environment
- In CloudWatch Service Map view you can click on one of the nodes and click on Container Insights to move to the metrics, logs and traces associated with that component